At midday in summer, the built-up surfaces of Moabit's Huttenkiez are on average seven and a half degrees hotter than those of Nikolassee. Berlin's heatwaves fall on the whole city, but the shade does not. Satellite data and the city's climate model for 536 neighbourhoods show who stays cool and who lies awake at night.
Words and analysis: Eugenio MincioneAbout 15 minutes
01HkHuttenkiez, Moabit+3.6 °Csurface, vs city medianat midday in summer; 24% of residents receive welfare benefits
02NkNikolassee−3.9 °Csurface, vs city medianat midday in summer; 4% of residents receive welfare benefits
03TnTropical nights22 vs 2nights not below 20 °C, 2024Alexanderplatz vs Dahlem weather stations
04ShShade gap3%of residentsof high-status areas live in the hottest fifth of Berlin (others: 17–27%)
05HtHeat deaths~3,000in Germany a yearestimated: about 3,100 in 2023 and 2,800 in 2024
Tiles 1, 2 and 4: this analysis (Landsat 8/9 surface temperature, mean of five summer scenes 2019–2025, built-up areas only; social data: SenSBW, 2024). Tile 3: Abgeordnetenhaus Berlin (2025), stations of the German Weather Service; a tropical night is one in which the temperature does not fall below 20 °C. Tile 5: an der Heiden (2025), Robert Koch Institute.
Chapter 1
Two summers in one city
Huttenstraße in Moabit, a weekday in July. The pavement is still warm at midnight, the courtyards of the old tenements hold the day's heat like ovens, and the few street trees cast thin shade. Some fourteen kilometres to the south-west, in Nikolassee, the same sun falls on gardens, lakes and the edge of the Grunewald forest. Both places are Berlin. They do not have the same summer.
Climatologists call this the urban heat island. Asphalt, stone and roofs soak up sunlight during the day and release it at night; buildings block the wind; there is little soil or vegetation to cool the air by evaporation. For air temperature, the effect is strongest at night. In 2024, the German Weather Service station at Alexanderplatz recorded 22 tropical nights, nights in which the temperature did not fall below 20 °C. The station in leafy Dahlem recorded two (Abgeordnetenhaus Berlin, 2025).
Research from many cities shows that this heat is not shared out at random. In a study of 25 cities around the world, poorer neighbourhoods were exposed to more urban heat in 72 per cent of cases (Chakraborty et al., 2019). Across 683 European cities, urban form, from building density to the amount of green space, explains around 70 per cent of how unequally surface heat is distributed (Mashhoodi & Muñoz Unceta, 2024). And a study of 14 European metropolitan areas, Berlin among them, found that lower-income residents, tenants and immigrants everywhere receive less cooling from urban greenery than homeowners and the well-off (Rocha et al., 2024).
This issue asks what that looks like in Berlin, neighbourhood by neighbourhood. Who gets the shade, and who is left with the heat?
Chapter 2
Who a heatwave kills
Heat stress is the leading climate-related cause of premature death in Europe (Rocha et al., 2024). In the summer of 2022 alone, an estimated 61,672 people in 35 European countries died from heat, 8,173 of them in Germany; relative to population, women were hit 56 per cent harder than men (Ballester et al., 2023). The Robert Koch Institute estimates about 3,100 heat-related deaths in Germany in 2023 and 2,800 in 2024 (an der Heiden, 2025). In Berlin, about five per cent of all deaths between 2001 and 2010 could be statistically linked to high temperatures, most of them among people aged 65 and over (Scherer et al., 2014).
Heat rarely appears on a death certificate. It kills by pushing an already weak heart, lung or kidney past its limit, and it kills most reliably at night, when the body cannot recover from the day. That is why the people at greatest risk are those who are old, ill, alone, and stuck indoors in a flat that never cools down. Almost 240,000 Berliners are 80 or older (Ärztekammer Berlin, 2026).
Money decides how well people can escape. A survey of Berlin households found that 37 per cent of those with a monthly income of at least €5,000 had air conditioning, and that residents of dense, closed blocks of flats perceived the most heat stress (Iqbal et al., 2025). A shaded garden, a top-floor flat with insulation or without, a weekend house in Brandenburg, the option to work from somewhere cooler: each of these is a way to buy distance from the heat. Those who cannot afford them stay where it is hottest.
UNEVEN Analysis · Original GIS study
Mapping who gets the shade
To map Berlin's heat, I used the thermal sensors of the Landsat 8 and 9 satellites. They measure how hot the ground, roofs and treetops are, the land surface temperature, recorded at about 100 metres and delivered on a 30-metre grid. I selected five largely cloud-free summer scenes covering the whole city, spread over the years 2019 to 2025 and taken at around midday local time (clouds were masked; on 11 August 2022 about a quarter of the city was obscured), the hottest of them on 2 July 2025, when the median surface temperature in Berlin's built-up areas reached 44 °C (USGS Landsat Collection 2 Level-2). To make days with different weather comparable, I expressed every pixel as the difference from that day's city-wide median, kept only pixels inside residential and other built-up blocks, so that forests, lakes and airfields do not distort the picture, and averaged the five days.
I then aggregated these values to Berlin's 542 planning areas (Planungsräume), small neighbourhoods of about 7,000 residents on average, and joined them with the city's official social monitoring for 2023, the Monitoring Soziale Stadtentwicklung (SenSBW, 2024). It rates 536 of these areas on a four-step social status index, from high to very low, based on unemployment, benefit receipt, child poverty and children in single-parent households. For night-time heat, I added the city's own climate model, which simulates the air temperature at 4 a.m. on a calm summer night for every block in Berlin (SenSBW & GEO-NET, 2025). Together the 536 areas are home to 3.85 million people.
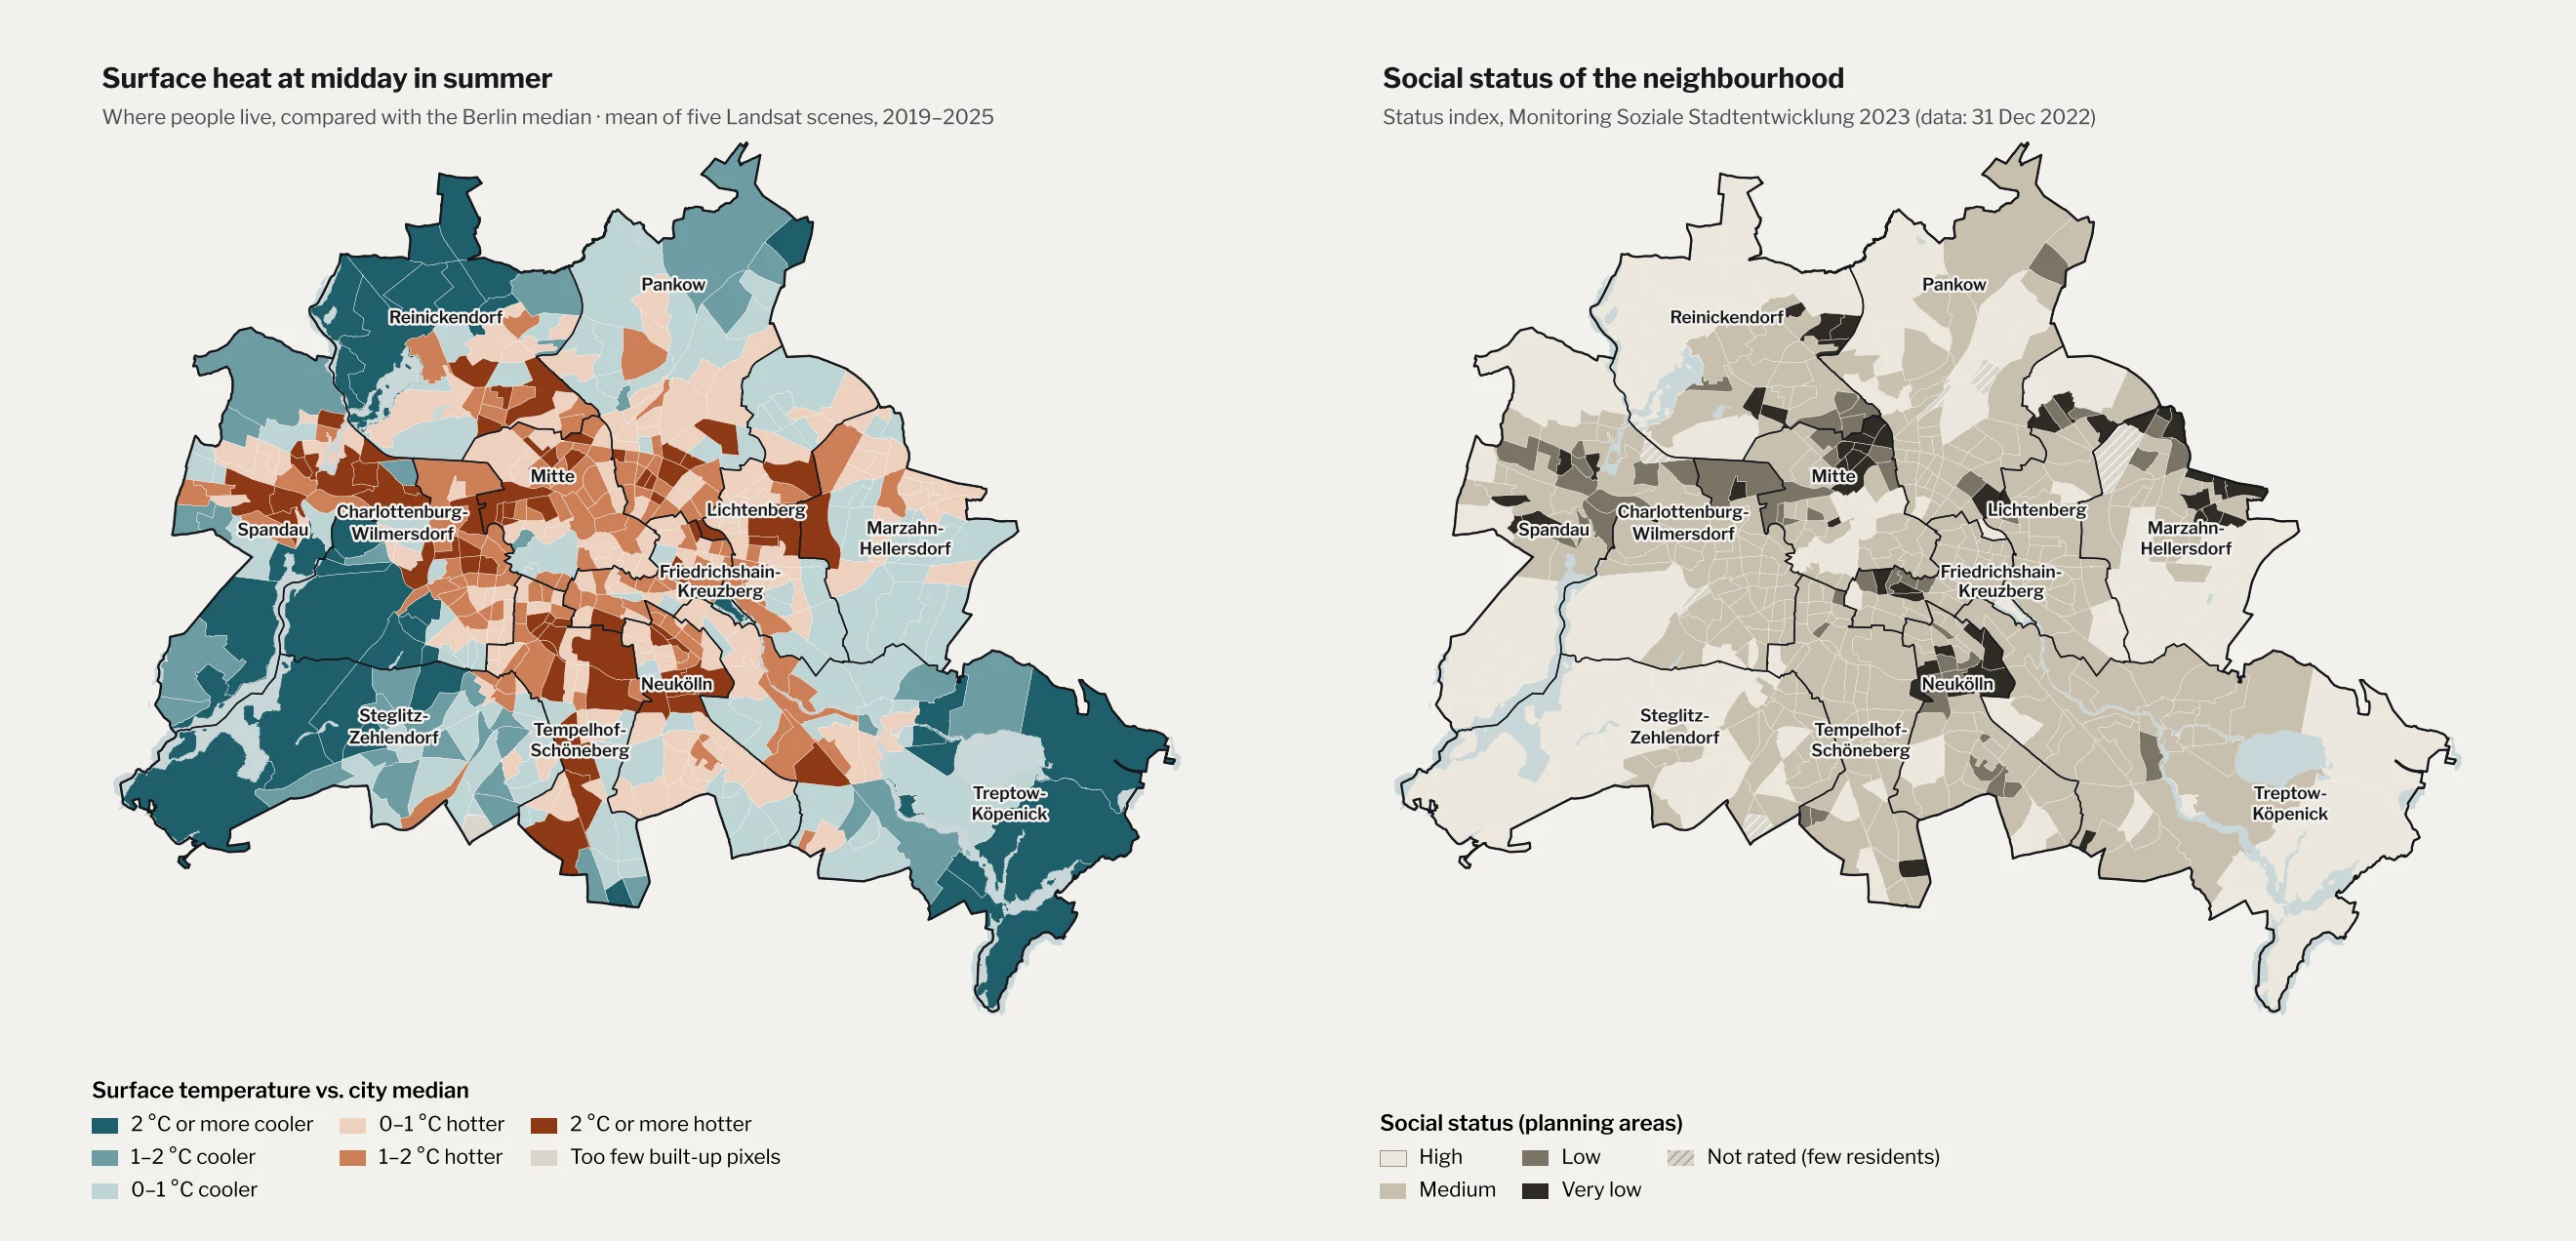
Figure 1 · Left: land surface temperature of built-up blocks relative to the city-wide median of each day, mean of five Landsat 8/9 scenes (26 July 2019, 24 June 2022, 11 August 2022, 24 August 2024, 2 July 2025; overpass around 12:00 CEST; WRS-2 path 193, row 023), by planning area (LOR 2021). A check with all twelve June–August scenes of 2019–2025 with less than 10% cloud cover gives a nearly identical map (r = 0.98). Right: status index of the Monitoring Soziale Stadtentwicklung 2023, data as of 31 December 2022. Data: USGS Landsat Collection 2 Level-2 via Microsoft Planetary Computer; SenSBW (2024); block geometry: Umweltatlas Berlin. ETRS89 / UTM 33N. Analysis and map: Eugenio Mincione.
1.9 °C
cooler: built-up areas in high-status neighbourhoods, compared with the rest of the city
3%
of residents of high-status areas live in the hottest fifth of Berlin's neighbourhoods
12 of 12
clear summer scenes from 2019–2025 show the same gap, between 1.3 and 3.8 °C
0.56
vegetation index in high-status areas, against 0.46 elsewhere: greenery accounts statistically for about 60% of the gap
The first result is a clear dividing line. The 86 planning areas with a high social status, home to 520,000 people, are on average 1.9 °C cooler at midday than the rest of the city. The gap appears on every one of the five days, from 1.4 °C on the mildest to 2.1 °C on 24 June 2022; on the hottest day, 2 July 2025, it was 1.9 °C. Put differently: only 3 per cent of people in high-status areas live in the hottest fifth of Berlin's neighbourhoods. Among residents of areas with medium status, the share is 23 per cent; with low status, 27 per cent; with very low status, 17 per cent (Figure 2).
Figure 2
Who lives in the hottest fifth of Berlin
Share of residents living in the 20% of planning areas with the highest midday surface temperature, by social status of their area
High status
3%
Medium status
23%
Low status
27%
Very low status
17%
Figure 2 · Population-weighted. Hottest fifth: the 20% of the 536 rated planning areas with the highest mean surface temperature anomaly (see Figure 1); 763,909 residents live there, 14,960 of them in high-status areas. Data: USGS Landsat Collection 2; SenSBW (2024). Analysis: Eugenio Mincione.
Is this simply the difference between the inner city and the suburbs? Partly. Berlin's poorer areas cluster in the dense Wilhelminian tenement districts within and around the S-Bahn ring, and in large housing estates on the edge, while many of its wealthiest areas are villa suburbs near forests and lakes. But the gap survives when distance is held constant (Figure 3). Within six kilometres of the centre, everyone swelters: high-status and other areas are almost equally hot. Six to twelve kilometres out, high-status areas are 1.3 °C cooler than their neighbours at the same distance. Beyond twelve kilometres, 1.9 °C. A statistical model confirms it: neighbourhoods with more people on benefits are hotter even at the same distance from the centre.
What separates them is green. Measured with the satellite vegetation index (NDVI), the built-up blocks of high-status areas are clearly greener, 0.56 against 0.46. Greenery within the built-up blocks, gardens, courtyards and street trees, statistically accounts for around 70 per cent of the differences in midday surface heat between neighbourhoods; with greenery in the model, distance to the centre adds nothing. An increase of 0.1 in the vegetation index goes with about 1.2 °C less surface heat. (Both measures come from the same satellite images, so this is an association, not proof of cause.) Even at equal greenery, high-status areas remain about 0.7 °C cooler, so vegetation accounts for roughly 60 per cent of the gap, not all of it.
Figure 3
The cool gap grows with distance from the centre
Midday surface temperature of built-up areas, difference from city median, by distance from the city centre (Brandenburg Gate)
High-status areasAll other areas
Under 6 km
0.2 °C
6–12 km
1.3 °C
Over 12 km
1.9 °C
-2 °C-1 °C0+1 °C+2 °C
Figure 3 · Population-weighted means of the surface temperature anomaly (see Figure 1). Distance measured from each planning area to the Brandenburg Gate. Under 6 km: 10 high-status and 165 other areas; 6–12 km: 32 and 184; over 12 km: 44 and 101. Analysis: Eugenio Mincione.
Method and limits. Landsat measures the temperature of surfaces, not of the air people breathe; surface and air temperature are related but not the same, and the satellite passes over at midday, not in the hottest hours of the afternoon. Values were averaged over built-up blocks, not weighted by where exactly people live inside a planning area. Benefit receipt (Transferbezug) counts recipients of SGB II/XII benefits who are not registered as unemployed. Social data describe areas, not individuals: not every resident of a poor area is poor, and the statistical relationships here say nothing about any single household. Correlations are Spearman rank correlations; the regressions are weighted by population with robust standard errors (Transferbezug and surface heat: ρ = 0.37; with distance and NDVI as controls, R² = 0.74). Robustness: the five scenes were chosen to span 2019–2025; repeating the analysis with all twelve June–August scenes with less than 10% cloud cover gives a gap of 2.0 °C (instead of 1.9), the gap appears in every single scene (1.3–3.8 °C), and the share of high-status residents in the hottest fifth is 5% (instead of 3%). Indoor temperatures, which matter most for health, are not covered by any of these data.
Chapter 3
The longest nights
Daytime heat is only half the story. What harms health most is when the night brings no relief. For this, the satellite data are not enough, so I used the city's own climate model. It shows how warm the air is at 4 a.m. on a still summer night, block by block. Across the planning areas the values range from 16.1 °C on the rural fringe to 19.3 °C in the densest inner-city blocks.
Here the pattern shifts. At night, the main divide is between the centre and the edge: the large housing estates of Marzahn or Spandau, with wide open spaces between their towers, cool down; the closed courtyards of Wedding, Kreuzberg and Neukölln do not. On their own, unemployment and benefit receipt say little about night-time heat once location is taken into account. One group, however, stands out: older people living in poverty.
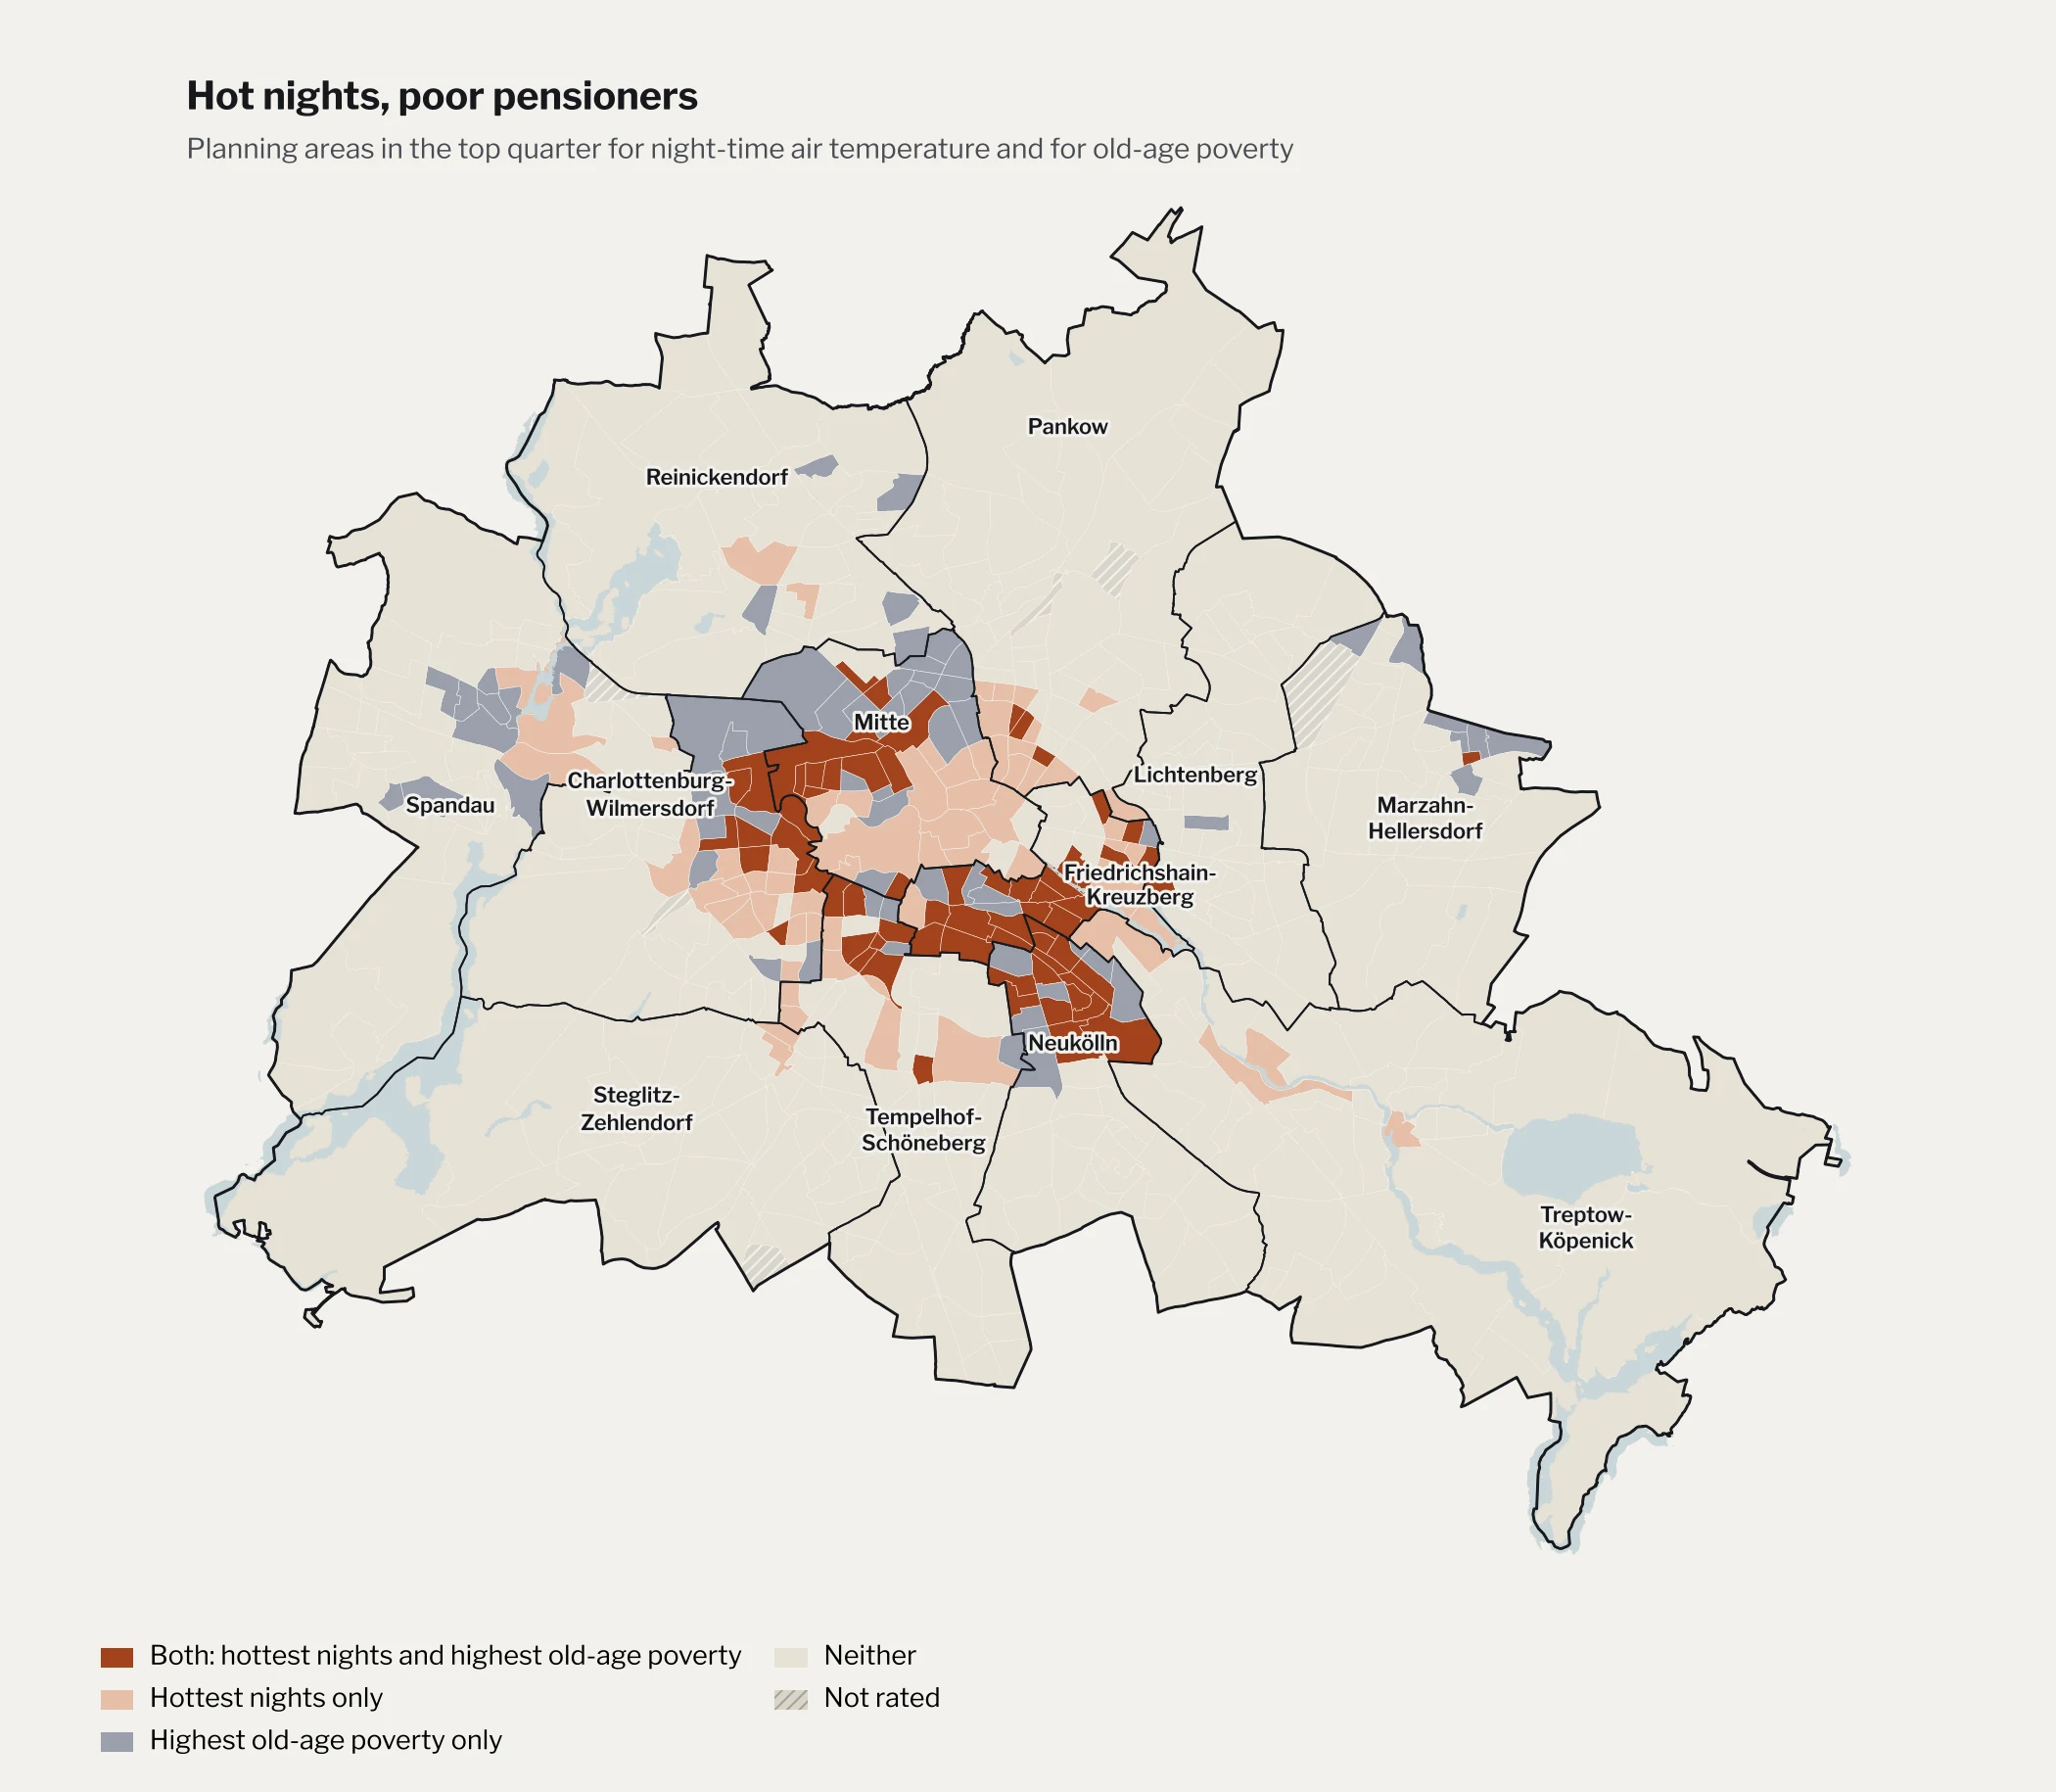
The social monitoring records the share of residents above the statutory retirement age who depend on basic income support in old age (Grundsicherung im Alter). Where this old-age poverty is highest, nights are hottest. Of the 134 planning areas in the top quarter for old-age poverty, 68, or half, are also in the top quarter for night-time temperature, twice as many as chance would predict. 546,000 people live in these 68 areas, most of them in Friedrichshain-Kreuzberg, northern Neukölln and Mitte (including Moabit and Wedding), with smaller clusters in Charlottenburg and Schöneberg (Figure 4). The link holds even at the same distance from the centre.
Figure 4 · Top quarter of the 536 rated planning areas: night-time air temperature of at least 18.26 °C (modelled 2 m air temperature at 4 a.m., area-weighted mean of built-up blocks) and old-age poverty of at least 10.8% (share of residents above the statutory retirement age receiving basic income support, data as of 31 December 2022). Data: SenSBW & GEO-NET (2025), Umweltatlas Berlin, climate analysis 2022 (FITNAH-3D, 10 m grid); SenSBW (2024). Analysis and map: Eugenio Mincione.
The two neighbourhoods from the beginning sit at opposite ends of every one of these measures. In the Huttenkiez in Moabit, 24 per cent of residents receive welfare benefits (not counting the registered unemployed), and 28 per cent of pensioners depend on basic income support. Its built-up blocks are 3.6 °C hotter than the city median at midday, its vegetation index is 0.18, and at 19.3 °C its modelled night is the warmest of all 536 planning areas. In Nikolassee, the figures are 4 and 3 per cent. Its blocks are 3.9 °C cooler than the median, its vegetation index is 0.68, and its night 17.3 °C.
A difference of two degrees at night sounds small. For an 85-year-old woman with heart failure on the fourth floor of a building without insulation, it can decide whether her body gets the few hours of recovery it needs.
Chapter 4
What the map does not show
The data also complicate the simplest version of this story. Berlin's poorest neighbourhoods are not its very hottest: areas with a very low social status are, on average, no hotter than areas with a medium one. The very hottest surfaces lie in mixed areas full of factories, warehouses and large flat roofs, such as Marienfelde or Borsigwalde, whose residents mostly have a medium status. Prenzlauer Berg, one of the most sought-after Altbau districts in the city, has some of its warmest nights. And some of the poorest areas are relatively cool: in Marzahn West, where almost one in five residents receives welfare benefits, the prefabricated blocks stand between generous green spaces, and the modelled night is two degrees cooler than in the Huttenkiez.
So the sharpest line in Berlin does not run between poor and middle-class neighbourhoods. It runs between the best-off fifth of the city and everyone else. Divided by benefit receipt into five equal groups of planning areas, the fifth with the fewest people on benefits is 0.7 °C cooler than the median; the other four are between 0.6 and 1.0 °C hotter, with the poorer two fifths slightly hotter than the middle. Cool surfaces at midday are largely a privilege of the villa suburbs.
That fits what other researchers have found. In Berlin, lower-income groups are concentrated in central areas with little green cooling, and Berlin is one of four of the 14 European metropolitan areas studied where low income and missing green cooling overlap most strongly in space (Rocha et al., 2024). Researchers who surveyed Berlin households found only a weak direct link between income and perceived heat, but a clearer one between perceived heat and dense building types (Iqbal et al., 2025). Heat follows the built form of the city, and the built form follows a long history of who could afford to live where.
What the map cannot show is perhaps the most important part: who can protect themselves indoors. A wealthy household in a hot Kreuzberg Altbau may own air conditioning, travel in August or sleep in the country. A pensioner on basic income support in Wedding usually cannot. Exposure is shared more widely than vulnerability.
Chapter 5
Shade as policy
Berlin has begun to respond. In August 2025 the Senate health department launched a heat protection portal with a map of cool places where people can escape the heat (SenWGP, 2025). A citywide heat action plan followed in November 2025 (Senatskanzlei Berlin, 2025). And after pressure from the citizens' initiative BaumEntscheid, the House of Representatives passed the BäumePlus law in November 2025, which for the first time sets legally binding targets for planting street trees in Berlin for climate adaptation. It foresees around 560,000 new street and park trees by 2040, for a total of one million, and about 170 "heat districts" in heavily sealed areas where streets and courtyards are to be unsealed and greened (Entwicklungsstadt, 2025a). Shortly afterwards, however, the governing coalition committed only about one billion euros up to 2040, against estimated costs of up to 3.2 billion (Entwicklungsstadt, 2025b).
The analysis here suggests two things for how that money is spent. First, heat and social data should be read together. A plan guided only by temperature will spend as much in well-off Prenzlauer Berg as in Moabit; a plan guided only by poverty will miss that the large estates on the edge are already relatively green. Where both overlap, in Figure 4, is where trees, shade and cool rooms protect the most vulnerable people.
Second, greening must not price out the people it is meant to protect. A study of 28 cities in Europe and North America found that in 17 of them, new parks and greenery in the 1990s and 2000s were followed by gentrification (Anguelovski et al., 2022). If Berlin's new trees end up raising rents in the Huttenkiez, the heat will simply move with the people who can no longer afford to stay.
Three levers
What it would take to share the shade
Lever 1
Plant where heat and poverty meet
Select the new "heat districts" with social data as well as climate data, so that the first trees go to areas like Moabit, Wedding and northern Neukölln.
Lever 2
Green without displacement
Pair greening with tenant protection, so that a shaded street does not become a reason to raise the rent (Anguelovski et al., 2022).
Lever 3
Reach people indoors
Trees take decades to grow. Until then, the people most at risk are old, poor and alone in hot flats. Care services, neighbours and cool rooms nearby reach them sooner.
Conclusion
Shade is a decision
So is Berlin hotter for some? Yes, but not in the way one might expect. The heat of the inner city is shared by the rich and the poor who live there. What is not shared is the cool. Berlin's high-status neighbourhoods are almost two degrees cooler at midday than the rest of the city, and only a tiny fraction of their residents live where it is hottest. At night, the warmest neighbourhoods tend to be those with the most old-age poverty, the group least able to escape the heat.
None of this is a law of nature. The cool of Nikolassee is the product of large plots, old trees and forests that were protected while other districts were built up densely for workers. The heat of Moabit is the product of decisions too: about where to build, where to plant, where to seal, and whose comfort counts. Berlin has committed around one billion euros up to 2040 to change that map, against estimated costs of more than three billion. Whether its new trees reach the people who need them most is the measure by which that spending should be judged.
Eugenio Mincione studies geography, specialising in geoinformatics and applied physical geography, alongside political science at LMU Munich. He is currently based in Madrid.
References
This article draws on peer-reviewed research, official statistics and open spatial data from the Berlin Senate and the US Geological Survey. The two news sources are marked as such and are used only for details of the new tree law and its funding. The GIS analysis and all graphics are original. Citation style: APA 7.
Abgeordnetenhaus Berlin. (2025). Hitze in Berlin – wie heiß ist es? Schriftliche Anfrage des Abgeordneten Benedikt Lux (Grüne) und Antwort des Senats, Drucksache 19/23353. pardok.parlament-berlin.de
an der Heiden, M. (2025). Hitzebedingte Mortalität in Deutschland 2023 und 2024. Epidemiologisches Bulletin, 19/2025, 3–9. Robert Koch-Institut. doi:10.25646/13135
Anguelovski, I., Connolly, J. J. T., Cole, H., Garcia-Lamarca, M., Triguero-Mas, M., Baró, F., Martin, N., Conesa, D., Shokry, G., Pérez del Pulgar, C., Argüelles Ramos, L., Matheney, A., Gallez, E., Oscilowicz, E., López Máñez, J., Sarzo, B., Beltrán, M. A., & Martinez Minaya, J. (2022). Green gentrification in European and North American cities. Nature Communications, 13, 3816. doi:10.1038/s41467-022-31572-1
Ärztekammer Berlin. (2026, June 8). Aktionsbündnis Hitzeschutz Berlin fordert: Pflegebedürftige Menschen besser vor Hitze schützen [Press release]. aekb.de
Ballester, J., Quijal-Zamorano, M., Méndez Turrubiates, R. F., Pegenaute, F., Herrmann, F. R., Robine, J. M., Basagaña, X., Tonne, C., Antó, J. M., & Achebak, H. (2023). Heat-related mortality in Europe during the summer of 2022. Nature Medicine, 29, 1857–1866. doi:10.1038/s41591-023-02419-z
Chakraborty, T., Hsu, A., Manya, D., & Sheriff, G. (2019). Disproportionately higher exposure to urban heat in lower-income neighborhoods: A multi-city perspective. Environmental Research Letters, 14, 105003. doi:10.1088/1748-9326/ab3b99
Entwicklungsstadt. (2025a, November). Berlin beschließt BäumePlus-Gesetz: 560.000 neue Stadtbäume bis 2040 [News article]. entwicklungsstadt.de
Entwicklungsstadt. (2025b, November 12). Weniger Geld für Berlins Stadtgrün: Koalition halbiert Budget für BäumePlus-Gesetz [News article]. entwicklungsstadt.de
Iqbal, N., Ravan, M., Mitraka, Z., Birkmann, J., Grimmond, S., Hertwig, D., Chrysoulakis, N., Somarakis, G., Wendnagel-Beck, A., & Panagiotakis, E. (2025). How does perceived heat stress differ between urban forms and human vulnerability profiles? Case study Berlin. Natural Hazards and Earth System Sciences, 25, 2481–2502. doi:10.5194/nhess-25-2481-2025
Mashhoodi, B., & Muñoz Unceta, P. (2024). Urban form and surface temperature inequality in 683 European cities. Sustainable Cities and Society, 113, 105690. doi:10.1016/j.scs.2024.105690
Rocha, A. D., Vulova, S., Förster, M., Gioli, B., Matthews, B., Helfter, C., Meier, F., Steeneveld, G.-J., Barlow, J. F., Järvi, L., Chrysoulakis, N., Nicolini, G., & Kleinschmit, B. (2024). Unprivileged groups are less served by green cooling services in major European urban areas. Nature Cities, 1, 424–435. doi:10.1038/s44284-024-00077-x
Scherer, D., Fehrenbach, U., Lakes, T., Lauf, S., Meier, F., & Schuster, C. (2014). Quantification of heat-stress related mortality hazard, vulnerability and risk in Berlin, Germany. DIE ERDE, 144(3–4), 238–259. doi:10.12854/erde-144-17
Senatskanzlei Berlin. (2025, November 25). Hitzeaktionsplan für Berlin beschlossen [Press release]. berlin.de
SenSBW – Senatsverwaltung für Stadtentwicklung, Bauen und Wohnen Berlin. (2024). Monitoring Soziale Stadtentwicklung Berlin 2023 [Report and WFS data service mss_2023]. berlin.de
SenSBW & GEO-NET Umweltconsulting. (2025). Umweltatlas Berlin: Klimaanalyse und Klimabewertung 2022 (documentation dated 2 June 2025) [Data and documentation; WFS services ua_klimaanalyse_2022 and ua_klimabewertung_2022]. berlin.de/umweltatlas
SenWGP – Senatsverwaltung für Wissenschaft, Gesundheit und Pflege Berlin. (2025, August 13). Abkühlung an heißen Tagen – Senatsgesundheitsverwaltung veröffentlicht Hitzeschutzportal und Karte zu kühlen Orten [Press release]. berlin.de
U.S. Geological Survey. (n.d.). Landsat 8-9 OLI/TIRS Collection 2 Level-2 [Data set; surface temperature band ST_B10, QA_PIXEL, surface reflectance bands 4 and 5]. doi:10.5066/P9OGBGM6